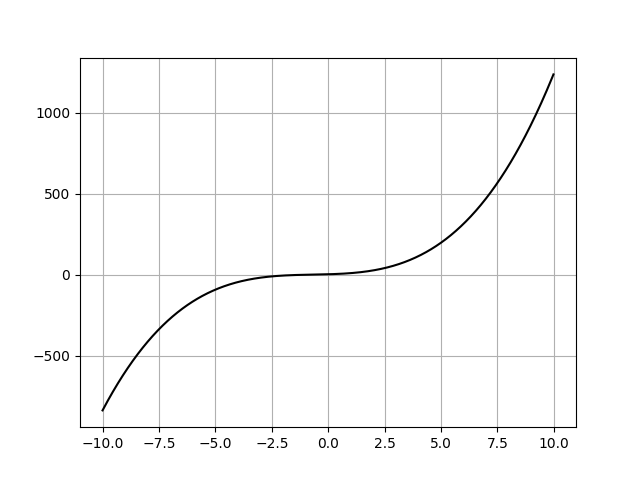
pythonで二次関数のグラフを描く。三次関数は
\begin{align}
f(x)=ax^3+bx^2+cx+d(a≠0)
\end{align}
のような関数でこれをただ計算すればいい。例えば
\begin{align}
y=x^3+2x^2+4x+3
\end{align}
であれば結果は次のようになる
以下ソースコード
import numpy as np
import matplotlib.pyplot as plt

x = np.arange(-10.0, 10.0, 0.02)
plt.plot(x, x**3 + 2 * x ** 2 + 4 * x + 3, 'k-')
plt.grid()
plt.show()


コメント