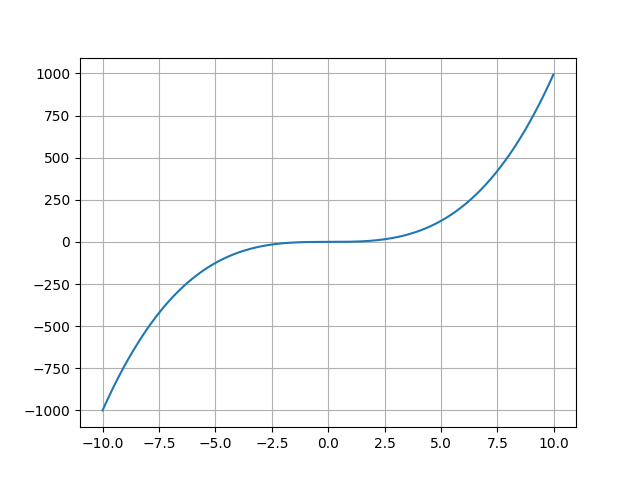
指数と対数のグラフを描く。以下ソースコード
import numpy as np
import matplotlib.pyplot as plt
x = np.arange(-10.0, 10.0, 0.02)
plt.plot(x, x**3)
plt.grid()
plt.show()
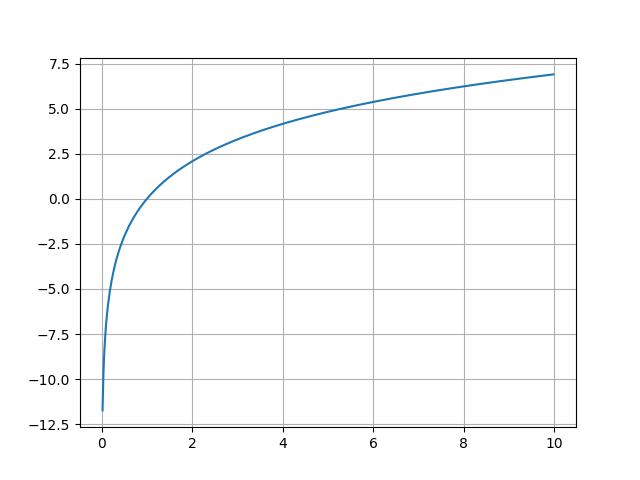
plt.plot(x, np.log(x**3))
plt.grid()
plt.show()
結果


 MATLAB/simulink
指数と対数のグラフを描く。以下ソースコード
import numpy as np
import matplotlib.pyplot as plt
x = np.arange(-10.0, 10.0, 0.02)
plt.plot(x, x**3)
plt.grid()
plt.show()
plt.plot(x, np.log(x**3))
plt.grid()
plt.show()
結果
コメント