問1(2)
\(\sin 2x\)と\(\sin x\)の値の大小関係を詳しく調べよう。
\begin{align}
\sin 2x – \sin x = (□ \cos x – □)
\end{align}
であるから\(\sin 2x – \sin x > 0\)が成り立つことは
\(\sin x > 0\)かつ\(□ \cos x – □ > 0\)
または
\(\sin x < 0\)かつ\(□ \cos x – □ < 0\)
が成り立つことと同値である。よって、\(0 \leq x \leq 2 \pi\)のとき\(\sin 2 x > \sin x\)が成り立つような\(x\)の値の範囲は
\begin{align}
0 < x < \frac{\pi}{□} , \pi < x < \frac{□}{□} \pi
\end{align}
である。
解
\begin{align}
\sin 2x – \sin x = (□ \cos x – □)
\end{align}
を倍角の公式を用いて変換する。倍角の公式はオイラーの公式より導出した結果より
\begin{align}
\sin 2 x = 2 \sin x \cos x
\end{align}
であるから
\begin{align}
\sin 2x – \sin x &= 2 \sin x \cos x – \sin x \\
&= \sin x (2 \cos x – 1 )
\end{align}
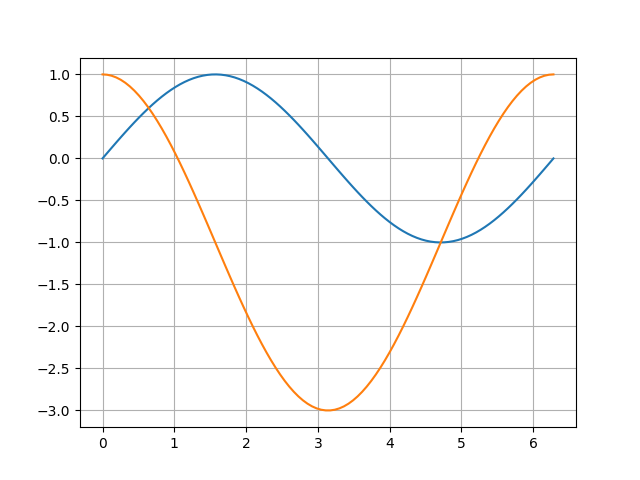
とりあえず\(\sin x \)と\(\sin x (2 \cos x – 1 )\)のグラフを描画する。一周期分のグラフは次のようになる。

ソースコード。
import numpy as np
import matplotlib.pyplot as plt

theta = np.linspace(0, 2*np.pi, 100)

P1 = np.sin(theta)
P2 = 2 * np.cos(theta) - 1

plt.plot(theta, P1, label="test")
plt.plot(theta, P2, label="test")

plt.grid()
plt.show()
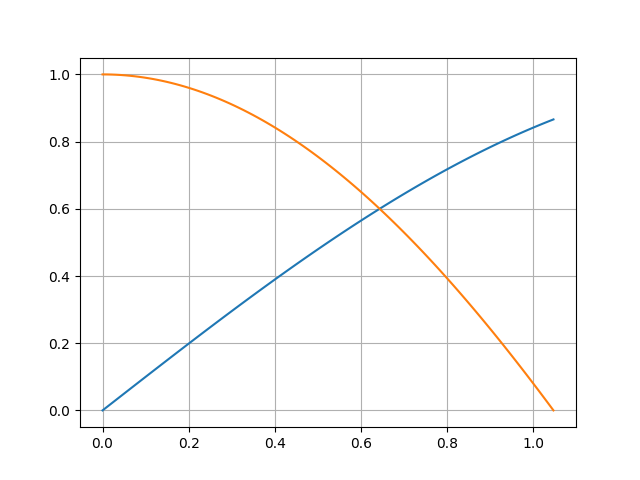
であるので
\(\sin x > 0\)かつ\(2\cos x – 1 > 0\)
を満たす\(x\)の値の範囲は
\begin{align}
0 < x < \frac{\pi}{3}
\end{align}
となる。グラフを拡大すれば次のとおりである。
ソースコード。
import numpy as np
import matplotlib.pyplot as plt

theta = np.linspace(np.pi, 5 * np.pi/3, 100)

P1 = np.sin(theta)
P2 = np.cos(theta) - 1

plt.plot(theta, P1, label="test")
plt.plot(theta, P2, label="test")

plt.grid()
plt.show()
同様に
\(\sin x < 0\)かつ\(2 \cos x – 1 < 0\)
は
\begin{align}
\pi < x < \frac{5}{3} \pi
\end{align}
となる。グラフを拡大すれば次のとおりである。
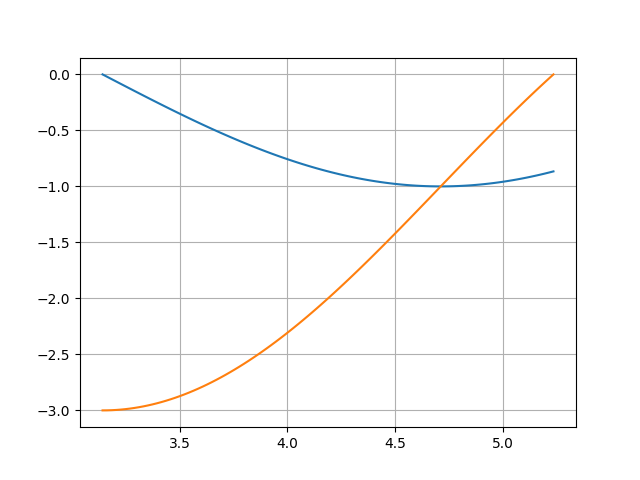
ソースコード
import numpy as np
import matplotlib.pyplot as plt

theta = np.linspace(np.pi, 5*np.pi/3, 100)

P1 = np.sin(theta)
P2 = 2 * np.cos(theta) - 1

plt.plot(theta, P1, label="test")
plt.plot(theta, P2, label="test")

plt.grid()
plt.show()
これより\(0 \leq x \leq 2 \pi\)のとき\(\sin 2 x > \sin x\)が成り立つような\(x\)の値の範囲は
\begin{align}
0 < x < \frac{\pi}{3} , \pi < x < \frac{5}{3} \pi
\end{align}
となる。

コメント