Pythonで三角関数
\begin{align}
y&= \sin x\\
y&= \cos x\\
y&= \tan x\\
\end{align}
を描く。結果
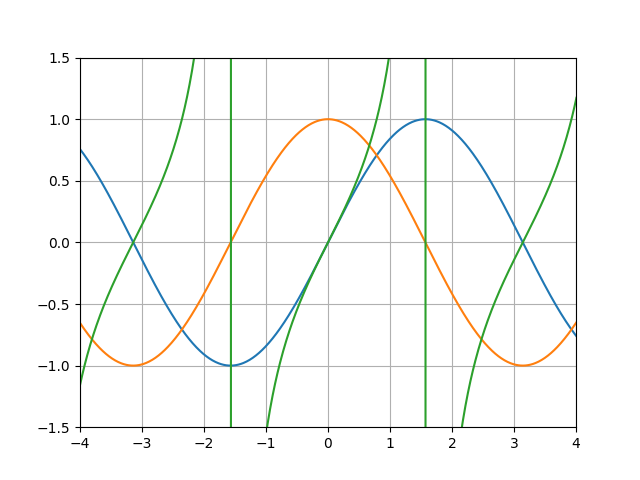
以下ソースコード
import numpy as np
import matplotlib.pyplot as plt

theta = np.arange(-2*np.pi, 2*np.pi, 0.01)
plt.plot(theta, np.sin(theta))
plt.plot(theta, np.cos(theta))
plt.plot(theta, np.tan(theta))
plt.grid()
plt.xlim([-4, 4])
plt.ylim([-1.5, 1.5])
plt.show()

コメント