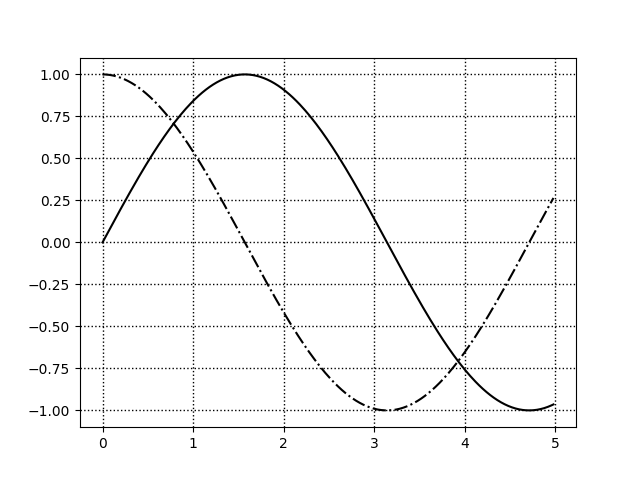
前回の結果のままでは見にくいのでgridを追加する。gridは
plt.grid(color='k', linestyle='dotted', linewidth=1)
で追加できる。引数を指定すればいろいろ変更できる。
import numpy as np
import matplotlib.pyplot as plt

x = np.arange(0.0, 5.0, 0.02)
plt.plot(x, np.sin(x), 'k-')
plt.plot(x, np.cos(x), 'k-.')
plt.grid(color='k', linestyle='dotted', linewidth=1)
plt.show()


コメント